 Achromycin BDBM50368781 Cyclopar Liquamycin Panmycin TETRACYCLINE
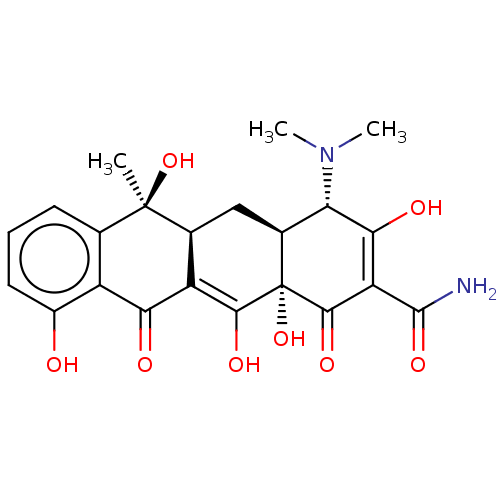 Supramycin Achromycin Cyclopar Liquamycin Vetquamycin Achromycin V Tetrabid Organon Tetracycline Sustamycin E701 Panmycin Tetracyn BDBM50237605 Economycin CHEBI:27902
 (2E,4S,4aS,5aS,6S,12aS)-2-[amino(hydroxy)methylidene]-4-(dimethylamino)-6,10,11,12a-tetrahydroxy-6-methyl-4,4a,5,5a-tetrahydrotetracene-1,3,12-trione cid_5388997 SMR000058220 TETRACYCLINE (2E,4S,4aS,5aS,6S,12aS)-2-[amino(hydroxy)methylene]-4-(dimethylamino)-6,10,11,12a-tetrahydroxy-6-methyl-4,4a,5,5a-tetrahydrotetracene-1,3,12-trione (2E,4S,4aS,5aS,6S,12aS)-2-[azanyl(oxidanyl)methylidene]-4-(dimethylamino)-6-methyl-6,10,11,12a-tetrakis(oxidanyl)-4,4a,5,5a-tetrahydrotetracene-1,3,12-trione BDBM32023 MLS000069728
 4-Dimethylamino-3,6,10,12,12a-pentahydroxy-6-methyl-1,11-dioxo-1,4,4a,5,5a,6,11,12a-octahydro-naphthacene-2-carboxylic acid amide (Tetracyclin) CHEMBL1440 BDBM50037064 (4S,4aS,6S,12aS)-4-Dimethylamino-3,6,10,12,12a-pentahydroxy-6-methyl-1,11-dioxo-1,4,4a,5,5a,6,11,12a-octahydro-naphthacene-2-carboxylic acid amide 4-Dimethylamino-3,6,10,12,12a-pentahydroxy-6-methyl-1,11-dioxo-1,4,4a,5,5a,6,11,12a-octahydro-naphthacene-2-carboxylic acid amide(Tetracycline) 4-dimethylamino-3,6,10,12,12a-pentahydroxy-6-methyl-1,11-dioxo-(4S,4aS,6S,12aS)-1,4,4a,5,5a,6,11,12a-octahydro-2-naphthacenecarboxamide 4-Dimethylamino-3,6,10,12,12a-pentahydroxy-6-methyl-1,11-dioxo-1,4,4a,5,5a,6,11,12a-octahydro-naphthacene-2-carboxylic acid amide
- Pommier, Y; Thibaut, L; Marchand, C Tetracycline compounds as tyrosyl-DNA phosphodiesterase I inhibitors US Patent US8865686 (2014)
- Vidal, A; Sabatini, M; Rolland-Valognes, G; Renard, P; Madelmont, JC; Mounetou, E Synthesis and in vitro evaluation of targeted tetracycline derivatives: effects on inhibition of matrix metalloproteinases. Bioorg Med Chem 15: 2368-74 (2007)
- Nelson, ML; Park, BH; Andrews, JS; Georgian, VA; Thomas, RC; Levy, SB Inhibition of the tetracycline efflux antiport protein by 13-thio-substituted 5-hydroxy-6-deoxytetracyclines. J Med Chem 36: 370-7 (1993)
- Sriram, D; Yogeeswari, P; Senchani, G; Banerjee, D Newer tetracycline derivatives: synthesis, anti-HIV, antimycobacterial activities and inhibition of HIV-1 integrase. Bioorg Med Chem Lett 17: 2372-5 (2007)
- ChEMBL_68323 (CHEMBL680694) Inhibition of [3H]tetracycline uptake into everted membrane vesicles, prepared from tetracycline resistant Escherichia coli D1-209
- ChEMBL_443295 (CHEMBL893545) Inhibition of tetracycline-induced iNOS expressed in SF9 cells
- Fluorescence Assay Inhibition of wild type beta-m fibrillogenesis tetracycline congeners and was follow by thioflavin fluorescence assay.
- ChEMBL_533809 (CHEMBL966834) Agonist activity at rat TRPA1 channel expressed in tetracycline induced HEK293 cells assessed as increase in intracellular calcium
- ChEMBL_629242 (CHEMBL1121356) Agonist activity at human TRPV1 expressed in tetracycline-stimulated HEK293 cells assessed as increase in intracellular calcium levels by fluorimetric assay
- ChEMBL_1569213 (CHEMBL3791637) Agonist activity at rat TRPA1 expressed in tetracycline-inducible T-REx expression system transfected CHO cells by 45Ca2+ uptake assay
- ChEMBL_1569214 (CHEMBL3791638) Agonist activity at human TRPA1 expressed in tetracycline-inducible T-REx expression system transfected CHO cells by 45Ca2+ uptake assay
- ChEMBL_629245 (CHEMBL1121359) Antagonist activity at human TRPV1 expressed in tetracycline-stimulated HEK293 cells assessed as inhibition of capsaicin-induced intracellular calcium levels by fluorimetric assay
- ChEMBL_756575 (CHEMBL1804788) Inhibition of hemagglutinin epitope-tagged human Nek2 transfected tetracycline-induced in human HEK293 cells pre-incubated for 45 mins by immunoprecipitation assay
- ChEMBL_982014 (CHEMBL2428369) Displacement of [125I]-ghrelin from human GHS-R1a expressed in tetracycline inducible HEK293 cells after 8 hrs by liquid scintillation counting
- ChEMBL_1757270 (CHEMBL4192278) Inhibition of capsid in HBV infected in human HepAD38 cells assessed as reduction in tetracycline-induced cccDNA formation by measuring reduction in HBe antigen secretion after 14 days by ELISA
- ChEMBL_2195620 (CHEMBL5108136) Inhibition of human LRRK2 G2019S mutant expressed in human SH-SY5Y cells assessed as inhibition of tetracycline induced LRRK2 phosphorylation at Ser935 residue incubated for 90 mins by MSD assay
- ChEMBL_1560500 (CHEMBL3776531) Inhibition of tetracycline-inducible EGFP-DYRK1A (unknown origin) expressed in HEK293 cells coexpressing full length human EGFP-tau protein assessed as reduction in tau-Thr212 phosphorylation incubated overnight by immunofluorescence assay
- ChEMBL_1568994 (CHEMBL3789594) Agonist activity at human TRPA1 expressed in tetracycline-inducible T-REx expression system transfected CHO cells assessed as increase in Ca2+ influx measured for 2 mins by Fluo-4 dye based FLIPR assay
- ChEMBL_1568995 (CHEMBL3789595) Agonist activity at rat TRPA1 expressed in tetracycline-inducible T-REx expression system transfected CHO cells assessed as increase in Ca2+ influx measured for 2 mins by Fluo-4 dye based FLIPR assay
- ChEMBL_1569211 (CHEMBL3791635) Antagonist activity at rat TRPA1 expressed in tetracycline-inducible T-REx expression system transfected CHO cells assessed as inhibition of AITC-induced 45Ca2+ uptake preincubated for 1 min followed by AITC addition measured after 12 mins
- ChEMBL_1569212 (CHEMBL3791636) Antagonist activity at human TRPA1 expressed in tetracycline-inducible T-REx expression system transfected CHO cells assessed as inhibition of AITC-induced 45Ca2+ uptake preincubated for 1 min followed by AITC addition measured after 12 mins
- ChEMBL_1568996 (CHEMBL3789596) Antagonist activity at human TRPV3 expressed in tetracycline-inducible T-REx expression system transfected CHO cells assessed as inhibition of 2-ABP-induced Ca2+ influx preincubated for 1 min followed by 2-ABP addition measured for 1 min by luminescence assay
- ChEMBL_1568990 (CHEMBL3789590) Antagonist activity at human TRPA1 expressed in tetracycline-inducible T-REx expression system transfected CHO cells assessed as inhibition of AITC-induced Ca2+ influx preincubated for 2 mins followed by AITC addition measured for 2 mins by Fluo-4 dye based FLIPR assay
- ChEMBL_1568991 (CHEMBL3789591) Antagonist activity at rat TRPA1 expressed in tetracycline-inducible T-REx expression system transfected CHO cells assessed as inhibition of AITC-induced Ca2+ influx preincubated for 2 mins followed by AITC addition measured for 2 mins by Fluo-4 dye based FLIPR assay
- ChEMBL_1569236 (CHEMBL3791660) Antagonist activity at rat TRPA1 expressed in tetracycline-inducible T-REx expression system transfected CHO cells assessed as inhibition of methylglyoxal-induced 45Ca2+ uptake preincubated for 10 mins followed by methylglyoxal addition measured after 3 mins by TopCount microplate scintillator counting method
- ChEMBL_1569237 (CHEMBL3791661) Antagonist activity at rat TRPA1 expressed in tetracycline-inducible T-REx expression system transfected CHO cells assessed as inhibition of hypo osmolarity buffer-induced 45Ca2+ uptake preincubated for 10 mins followed by hypo osmolarity buffer addition measured after 3 mins by TopCount microplate scintillator counting method
- Assay on TRPM8 Modulators A test comparable with that previously described in the literature by Behrendt H. J. et al., Br. J. Pharmacol. 141, 2004, 737-745, is carried out. The agonisation or antagonisation of the receptor can be quantified by means of a Ca2+-sensitive dye (e.g. FURA, Fluo-4, etc.). Agonists on their own bring about an increase in the Ca2+-signal; antagonists in the presence of, for example, menthol bring about a reduction in the Ca2+-signal (in each case detected by means of the Fluo-4 dye, which due to the Ca2+ has other fluorescent properties).To begin with, in a manner known per se, in cell culture flasks a fresh culture of transformed HEK cells is prepared. The HEK293-TRPM8 test cells are removed using trypsin from the cell culture flasks and 40 000 cells/well are sown with 100 μl medium in 96-well plates (Greiner #655948 Poly-D-lysine coated). In order to induce the TRPM8 receptor the growth medium tetracycline is mixed in (DMEM/HG, 10% FCS tetracycline-free, 4 mM L-glutamine, 15 μg/ml blasticidin, 100 μg/ml hygromycin B, 1 μg/ml tetracycline). The next day the cells are charged with Fluo-4Am dye and the test is performed. The procedure is as follows: Addition of 100 μl/well of dye solution Ca-4 Kit (RB 141, Molecular Devices) per 100 μl of medium (DMEM/HG, 10% FCS tetracycline-free, 4 mM L-glutamine, 15 μg/ml blasticidin, 100 μg/ml hygromycin B, 1 μg/ml tetracycline). Incubation in the incubator for 30 minutes/37� C./5% CO2, 30 minutes/RT. Preparation of the test substances (different concentrations in 200 μl HBSS buffer), and of positive controls (different concentrations of menthol or icilin or ionomycin in 200 μl HBSS buffer) and negative controls (just 200 μl of HBSS buffer). Addition of the test substances in quantities of 50 μl/well and measurement of the change in fluorescence (e.g. in the FLIPR assay device, Molecular Devices or NovoStar, BMG) at 485 nm excitation, 520 nm emission, and evaluation of the effective strength of the various substances/concentrations and determination of the EC50 values.The test substances are used in triplicate in concentrations of between 0.1 and 200 μm in the assay. Normally the compounds are kept ready in DMSO solutions and diluted for the assay to a maximum DMSO concentration of 2%.
- Inhibition Assay Preparation of rhACC2. Human ACC2 inhibition was measured using purified recombinant human ACC2 (hrACC2). Briefly, a full length Cytomax clone of ACC2 was purchased from Cambridge Bioscience Limited and was sequenced and subcloned into PCDNA5 FRT TO-TOPO (Invitrogen, Carlsbad, Calif.). The ACC2 was expressed in CHO cells by tetracycline induction and harvested in 5 liters of DMEM/F12 with glutamine, biotin, hygromycin and blasticidin with 1 ug/mL tetracycline (Invitrogen, Carlsbad, Calif.). The conditioned medium containing ACC2 was then applied to a Softlink Soft Release Avidin column (Promega, Madison, Wis.) and eluted with 5 mM biotin. 4 mgs of ACC2 were eluted at a concentration of 0.05 mg/mL (determined by A280) with an estimated purity of 95% (determined by A280). The purified ACC2 was dialyzed in 50 mM Tris, 200 mM NaCl, 4 mM DTT, 2 mM EDTA, and 5% glycerol. The pooled protein was frozen and stored at -80 C., with no loss of activity upon thawing.
- Tet-Inducible cAMP Assay A human-mouse chimeric GPR119 expression construct encoding 3 copies of the FLAG epitope tag, the first 198 amino acids of human GPR119 and the C-terminal 137 amino acids of the mouse receptor was cloned into a tetracycline inducible vector pcDNA5/FRT/TO (Invitrogen #V6520-20), which includes a hygromycin-resistance marker. Tightly controlled receptor expression was achieved by stable integration of this construct into the genome of a specific host cell line, Flp-In-T-Rex-HEK293, expressing the tetracycline repressor (Invitrogen). Once a stable hygromycin-resistant cell line was generated, the cells were maintained at 37� C. in a humidified 5% CO2 atmosphere in culture medium consisting of Dulbecco's modified Eagle's medium (DMEM; Invitrogen #11960) supplemented with 2 mM L-glutamine, 10% fetal bovine serum, 200 μg/ml hygromycin B, and 15 μg/ml blasticidin.
- Intracellular Calcium Mobilization Assay MRGPRX2 stable cells were maintained in DMEM containing 10% FBS, 100 μg/ml hygromycin B, and 15 μg/ml blasticidin. For the calcium mobilization assay, cells were plated into glass bottomed, poly-L-lysine coated, black 384 well plates at a density of 20,000 cells/well in medium containing 1% dialyzed FBS, 1 μg/ml tetracycline, 100 IU/ml penicillin and 100 μg/ml streptomycin and incubated 24 h. Following tetracycline induction, medium was removed and cells were loaded with 20 μl/well of 1× FLIPR Calcium dye (Molecular Devices) and 2.5 mM probenic acid, for 1 h in a humidified environment at 37 °C with 5% CO2. For mast cell calcium experiments, cells were seeded at a density of 50,000 cells/well in Tyrode's buffer containing 1× calcium dye and incubated for 1 h before treatment and analysis. After dye loading, baseline was measured for 10 s before drug treatment, and then cells were treated with 10 μl of 3× concentrated drug in drug buffer (1× HBSS with 20 mM HEPES and 2.5 mM probenic acid, pH 7.4) in 16 point concentration response curves from 100 μM to 0.003 nM.
- thallium-flux assay The thallium flux assay is an in vitro method of measuring conductance through a potassium ion channel. Potassium channels are also permeable to thallium ions. The modulation of a K+ channel will thus increase or decrease thallium ion flow through the channel and thus, alter the observed fluorescence of a thallium-specific indicator dye.Stably transfected T-Rex-HEK-293-AnKir1 cells were cultured overnight in 384-well plates in media containing DMEM, 10% dialyzed FBS, and 1 μg/mL tetracycline to induce channel expression. The next day the cell culture medium was replaced with a dye-loading solution containing assay buffer (Hanks Balanced Salt Solution with 20 mM HEPES, pH 7.3), 0.01% (w/v) Pluronic F-127 (Life Technologies, Carlsbad, Calif.), and 1.2 μM of the thallium-sensitive dye Thallos-AM (TEFlabs, Austin, Tex.). After 1 hr incubation at room temperature, the dye-loading solution was washed from the plates and replaced with 20 μL/well of assay buffer. The plates were transferred to a Hamamatsu Functional Drug Screening System 6000 (FDSS6000; Hamamatsu, Tokyo, Japan), where 20 μL/well of each of the test compounds in assay buffer was added and allowed to incubate with the cells for 20 min. After incubation, a baseline recording was collected at 1 Hz for 10 s (excitation 470�20 nm, emission 540�30 nm); a thallium stimulus buffer was then added (10 μL/well), and data were then collected for an additional 4 min. The Tl+ stimulus buffer contained (in mM): 125 NaHCO3, 1.8 CaSO4, 1 MgSO4, 5 glucose, 12 Tl2SO4, 10 HEPES, pH 7.4. For Tl+ flux assays on Kir2.x, Kir4.1 and Kir6.2/SUR1 expressing cells, the Tl+ stimulus buffer contained 1.8 mM Tl2SO4. To ensure the small-molecule vehicle DMSO had no direct effect on AnKir1-dependent Tl+ flux, the assay's tolerance to different doses of DMSO was evaluated. The robustness and reproducibility of the assay was determined by comparing Tl+ flux through tetracycline-induced and tetracycline-free cells.
- Competition Binding Assay This membrane based assay measures the ability of compounds to competitively bind GPR139 in stably transfected CHO-TRex membranes. CHO-TRex (Life Technologies) cells were stably expressed with human GPR139 receptor, whose expression is controlled by a tetracycline inducible element. The cells were cultured in medium containing F12K, 10% Tetracycline free FBS, 1% Penn/Strep, 200 μg/mL Hygromycin. GPR139 receptor expression was induced for 18 hrs with 1 μg/mL doxycycline (Sigma D9891) in growth media. After addition of doxycycline, cells were harvested in PBS and pelleted by centrifugation for 5 minutes at 200�G. Liquid was aspirated off and cells were resuspended in ice cold Lysis buffer (20 mM HEPES/5 mM EDTA pH 7.4/1� Roche protease inhibitor). Samples were vortexed until homogenous and then placed on ice and homogenized using Dounce homogenizer on 50% power 3 separate times for 10 strokes each time. Lysate was centrifuged at 4� C. for 10 minutes in a tabletop Sorvall at 2000�G and supernatant was recovered and centrifuged in a Sorvall Ultracentrifuge at 35,000 rpm for 30 minutes at 4� C. The supernatant was discarded and the remaining pellet resuspended in Lysis buffer (20 mM HEPES/0.1 mM EGTA/Roche protease inhibitor). Membrane protein concentration was determined using ThermoFisher BCA quantification kit and aliquoted into microtubes. Tubes were snap frozen in LN2 and stored at −80� C.
- FLIPR Assay Activation of the mGluR5 receptor expressed in cell lines results in an increase in intracellular calcium concentration. Using calcium sensitive fluorescent dyes and a suited fluorescence plate reader this functional response is detectable and quantifiable. This technique could be used to characterize pharmacological modifications of the mGluR5 receptor.[Ca]i measurements were performed in HEK293 cells stably expressing the full-length human mGlu5a receptor under the control of a tet-regulated promoter. Cells were cultivated in Dulbecco's modified eagle's medium (DMEM) with 10% fetal calf serum, 100 ug/ml HygromycinB, 500 ug/ml G418 and 2 ug/ml Tetracycline in a 37, 95% humidity and 5% CO2 incubator. Confluent cell cultures were split on a bi-weekly schedule.72 hours prior to the assay run mGluR5a expression was induced by replacing the culture medium by DMEM with 10% fetal calf serum without antibiotics.
- mGlu3 Ca2+ Flux Assay Gα15/TREx cells stably expressing rat mGlu3 were plated in black-walled, clear-bottomed, poly-D-lysine coated 384-well plates in 20 μL of assay medium (DMEM containing 10% dialyzed FBS, 20 mM HEPES, 25 ng/mL tetracycline, 100 units/mL penicillin/streptomycin plus 250 ng/mL Fungizone, and 1 mM sodium pyruvate) at a density of 15K cells/well. The cells were grown overnight at 37� C. in the presence of 5% CO2. The next day, medium was removed and the cells incubated with 20 μL of 2.3 μM Fluo-4, AM prepared as a 2.3 mM stock in DMSO and mixed in a 1:1 ratio with 10% (w/v) pluronic acid F-127 and diluted in assay buffer (Hank's balanced salt solution, 20 mM HEPES, and 2.5 mM probenecid) for 60 minutes at room temperature. Dye was removed, 20 μL of assay buffer was added, and the plate was incubated for 10 minutes at room temperature.
- GPR6 In Vitro Assay (A.2) This cell based assay measures the ability of compounds to inhibit the constitutive cAMP activity of GPR6 receptor expressed in CHO-K1 cells. CHO cells were stably expressed with GPR6 receptor, whose expression is controlled by a tetracycline inducable element. The cells were cultured in medium containing F12K, 10% FBS, 1% PennStrep, 200 ug/mL Hygromycin. GPR6 receptor expression was induced for 20 hrs with 2 ug/ml doxycycline (sigma D9891) in growth media. After addition of doxycycline cells were plated at a density of 450-750 cells per well in 96-well half-volume black tissue culture plates (Costar) and placed in an incubator (37°, 5% CO2) for 20 hours prior to cAMP assays. Culture media was removed from cells and they were washed with 50 uL/well of Ringer's Buffer (MgCl2 0.047 mg/mL, NaH2PO4 0.18 mg/mL, Na2HPO4 0.1 mg/mL, KCl 0.34 mg/mL, NaHCO3 1.26 mg/mL, D-glucose 1.8 mg/mL, NaCl 7 mg/mL; pH=7.4). Compounds suspended in DMSO were diluted in Ringer's Buffer.
- Beta-Arrestin Recruitment (Tango) Assay Recruitment of β-arrestin to agonist-stimulated D2 receptors was performed using a previously described Tango-type assay (Barnea et al., Proc. Natl. Acad. Sci. USA 105:64 (2008)). Briefly, HTLA cells stably expressing β-arrestin-TEV protease and a tetracycline transactivator-driven luciferase were plated in 15-cm dishes in DMEM containing 10% fetal bovine serum and transfected (via calcium phosphate) with 20 μg of a D2V2-TCS-tTA construct (Barnea et al., Proc. Natl. Acad. Sci. USA 105:64 (2008)). The next day, cells were plated in white, clear-bottom, 384-well plates (Greiner, 10,000 cells/well, 50 μl/well) in DMEM containing 1% dialyzed fetal bovine serum. The following day, the cells were challenged with 10 μl/well of reference agonist (6 μM) or D2 test ligand (6 μM)�reference agonist prepared in HBS, 20 mM HEPES, pH 7.4, 18% DMSO (final ligand concentrations were 1 μM, final DMSO concentration was 3%).
- GPR6 In Vitro Assay (A.1) This cell based assay measures the ability of compounds to inhibit the constitutive cAMP activity of GPR6 receptor expressed in CHO-K1 cells. CHO cells were stably expressed with GPR6 receptor, whose expression is controlled by a tetracycline inducable element. The cells were cultured in medium containing F12K, 10% FBS, 1% PennStrep, 200 ug/mL Hygromycin. GPR6 receptor expression was induced for 20 hrs with 1 ug/ml doxycycline (sigma D9891) in growth media. After addition of doxycycline cells were plated at a density of 250-500 cells per well in half-volume black clear bottom plates (Costar) and place in an incubator (37° C, 5% C(O)2) for 20 hours prior to cAMP assays.Culture media was removed from cells and they were washed with 50 uL of Ringer's Buffer (MgCl2 0.047 mg/mL, NaH2PO4 0.18 mg/mL, Na2HPO4 0.1 mg/mL, KCl 0.34 mg/mL, NaHC(O)3 1.26 mg/mL, D-glucose 1.8 mg/mL, NaCl 7 mg/mL; pH=7.4). Compounds suspended in DMSO were diluted in Ringer's Buffer.
- Calcium Fluorescence Measurements Cells were seeded into black-walled, clear-bottom, 96-well plates at a density of 80000 cell/well, in RPMI (without Phenol Red, without L-glutamine; Gibco LifeTechnologies, CA) supplemented with 10% dialyzed FBS. Following 18-h incubation with tetracycline, the cells were loaded with 2 mM Ca2+-sensitive fluorescent dye Fluo-4/AM (Molecular Probes) in Hanks' balanced saline solution (HBSS, Gibco LifeTechnologies, CA) with 20 μM Hepes (Sigma) and 2.5 mM probenecid (Sigma), for 1 h at 37� C. The cells were washed three times with HBSS to remove extracellular dye. Fluorescence signals were measured by using the fluorescence microplate reader Flexstation III (Molecular Devices) at sampling intervals of 1.5 s for 60 s.The antagonist potency was determined using the EC80 of the quisqualate used as agonist and the potentiation of mGlu5 activation was determined using the EC20 of the agonist (quisqualate or glutamate). The compounds were applied 10 minutes before the application of the agonist.The negative allosteric modulator activity (expressed as IC50) and the positive allosteric modulator activity (expressed as EC50) of the compounds of the invention for the mGlu5 receptors is between 0.1 and 1000 nM. For instance, and in particular compounds 31 and 48 have an IC50 of 13.5 and 2.02 nM respectively, and compound 34 has an EC50 of 107.2 nM.
- High Throughput Screening Assay The commercially available HEK293/TREx line (Invitrogen) was stably transfected with a TRPC6 construct and screened by conventional calcium imaging to find clones with TRPC6 expression following stimulation with 1 μg/ml tetracycline. These cells were maintained in the growth medium recommended by the manufacturer supplemented with 100 μg/ml hygromycin to promote retention of the TRPC6 construct. After growing to near confluency, cells were plated at a density of 35,000 cells/well in 384 well CellBind plates (Corning) in the presence of 1 μg/ml tetracycline, and allowed to grow for 20-30 hrs. A nearly confluent monolayer resulted. Growth media was removed from the wells and cells were then loaded with 25 mL Fluo4/AM diluted in Ringer's Solution (6.5 g NaCl, 0.42 g KCl, 0.25 g CaCl2 and 0.2 g of sodium bicarbonate; pH 7.4) supplemented with 1% Pluronic F-127 to a final concentration of 0.5 μM and incubated for 60 min, at room temperature. Dye solution was then removed from the cells by inverting plates with a sharp flick, and replaced with 25 μl Ringer's. Following 0.5 hour for recovery from loading, cells were assayed using the Hamamatsu FDSS 6000 system, which permitted illumination at 485 nm. Frames were acquired at a rate of 0.2 Hz. During the assay, the plates were continuously vortexed, with pipette mixing of wells following addition of each reagent. For the screening assay, 26 μl of a diluted compound stock (at 50 μM) was added to each well for 2 minutes following the collection of a short (4 frame) baseline. 13 μl of agonist solution consisting of 125 nM GSK1702934A diluted in high-Ca2+Ringer solution (containing 90 mm Ca2+) was then added to each well, achieving a final concentration of 20 mm Ca2+ and 10 μM test compound. Data was collected for 3 minutes following addition of high Ca2+Ringer. The fluorescent ratio for each well was divided by the initial fluorescent intensity for that well and the overall response was determined by averaging the fluorescent ratio of the last 4 frames acquired during the experiment excepting the final frame. Negative and Positive controls were included on each plate. Negative controls wells consisted of HEK293/TREx TRPC6 cells exposed to assay buffer and agonist solution, but no test compound. Positive control consisted of wells consisted of HEK293/TREx TRPC6 cells exposed to 25 μM 3-[(2-chlorophenoxy)methyl]phenyl piperidyl ketone (Chembridge) diluted in Ringer's solution and agonist solution. These controls defined zero percent and 100 percent block respectively, and intensity of each well was normalized to these values.
- Biological Assay Cell Culture and plating: HEK293 cells expressing NR1/NR2A (Chantest, Cleveland, Ohio) were grown to 70-80% confluency as an adherent monolayer in standard tissue culture flasks at 37� C., 5% CO2 per supplier's instructions. NR2A expression was induced by incubation with 0.3-0.4 μg/ml tetracycline in the presence of 4 mM ARL-15896 for 18-24 hours under the same growth conditions, then transferred to 30� C. for another 3-5 hours.After induction, cell culture medium was removed and cells were rinsed once with Ca2+ and Mg2+-free Dulbecco's phosphate buffered saline. Cells were then removed from the flask using TrypLE Express (Life Technologies) according to the manufacturer's instructions and collected to 50 ml centrifuge tubes. Following two washes in Ca2+/Mg2+-free HBSS with 20 mM HEPES (HHnoCa), cells were counted and viability assessed using trypan blue. To load cells with Ca2+-sensitive dye, they were resuspended in fluo-8 plus Component B (AAT Bioquest Products) diluted in HHnoCa and incubated 15 minutes at 37� C., followed by 30 minutes at room temp (in dark). Cells were then washed and resuspended in HHnoCa to remove extracellular dye and plated in 384-well plates (Falcon, uncoated) at 20,000-30,000 cells/well in a final volume of 25 μL/well.
- In Vitro Assay In general, Trex HEK293 cells were stably transfected with an inducible expression vector containing the full-length cDNA coding for the desired human sodium channel α-subunit and with an expression vector containing full length cDNA coding for the β1-subunit. Sodium channel expressing cell lines were induced with tetracycline (1 μg/mL) and plated on 384-well PDL-coated plates at a density of 25K-30K cells/well in culture media (DMEM, containing 10% FBS and 1% L-glutamine). After overnight incubation (37� C., 5% CO2), culture media was removed and cells were loaded with 5 uM ANG2 dye for 1-1.5 h in Buffer 1 (155 mM NMDG, 5 mM KCl, 2 mM CaCl2, 1 mM MgCl2, 10 mM HEPES, 10 mM glucose, adjusted with Tris to pH 7.4). Access dye was removed and cells were incubated with test compounds for 1 hr in buffer 1 containing sodium channel modulator(s) at room temperature. Hamamatsu FDSS μCell was used to perform a 1:1 addition of Na/K challenge buffer (140 mM NaCl, 20 mM HEPES, 1 mM CaCl2, 15 mM KCl, 1 mM MgCl2, 10 mM glucose, adjusted with Tris to pH 7.4) and simultaneously read plates at excitation wavelength of 530 nm and emission wavelength set at 558 nm.
- NR2B NAM Assay Cell Culture and plating: HEK293 cells expressing NR1/NR2B (Chantest, Cleveland, Ohio) were grown to 70-80% confluency as an adherent monolayer in standard tissue culture flasks at 37� C., 5% CO2 per supplier's instructions. NR2B expression was induced by incubation with 0.3-0.4 μg/ml tetracycline in the presence of 4 mM ARL-15896 for 18-24 hours under the same growth conditions, then transferred to 30� C. for another 3-5 hours.After induction, cell culture medium was removed and cells were rinsed once with Ca2+ and Mg2+-free Dulbecco's phosphate buffered saline. Cells were then removed from the flask using TrypLE Express (Life Technologies) according to the manufacturer's instructions and collected to 50 ml centrifuge tubes. Following two washes in Ca2+/Mg2+-free HBSS with 20 mM HEPES (HHnoCa), cells were counted and viability assessed using trypan blue. To load cells with Ca2+-sensitive dye, they were resuspended in fluo-8 plus Component B (AAT Bioquest Products) diluted in HHnoCa and incubated 15 minutes at 37� C., followed by 30 minutes at room temp (in dark). Cells were then washed and resuspended in HHnoCa to remove extracellular dye and plated in 384-well plates (Falcon, uncoated) at 20,000-30,000 cells/well in a final volume of 25 μl/well.
- In Vitro Assay In general, Trex HEK293 cells were stably transfected with an inducible expression vector containing the full-length cDNA coding for the desired human sodium channel α-subunit and with an expression vector containing full length cDNA coding for the β1-subunit. Sodium channel expressing cell lines were induced with tetracycline (1 μg/mL) and plated on 384-well PDL-coated plates at a density of 25K-30K cells/well in culture media (DMEM, containing 10% FBS and 1% L-glutamine). After overnight incubation (37� C., 5% CO2), culture media was removed and cells were loaded with 5 uM ANG2 dye for 1-1.5 h in Buffer 1 (155 mM NMDG, 5 mM KCl, 2 mM CaCl2, 1 mM MgCl2, 10 mM HEPES, 10 mM glucose, adjusted with Tris to pH 7.4). Access dye was removed and cells were incubated with test compounds for 1 hr in buffer 1 containing sodium channel modulator(s) at room temperature. Hamamatsu FDSS μCell was used to perform a 1:1 addition of Na/K challenge buffer (140 mM NaCl, 20 mM HEPES, 1 mM CaCl2, 15 mM KCl, 1 mM MgCl2, 10 mM glucose, adjusted with Tris to pH 7.4) and simultaneously read plates at excitation wavelength of 530 nm and emission wavelength set at 558 nm. Percent inhibition of sodium ion influx was calculated for each test compound at each test concentration to determine the IC50 values.
- Calcein Quenching Fluostar Assay A calcein quenching fluostar assay was performed in order to investigate the biological activity of the newly synthesized examples 1 to 57. This type of assay is disclosed in J. Biol. Chem., 2011, 286, 44319-44325 and Am. J. Physiol. Renal Physiol. (2010), 298, F224-230.The buffers used in the assay were prepared with the following compounds and quantities.500 ml of 4� buffer:3.2 mM MgSO4.7H2O (0.395 g)20 mM KCl (0.746 g)7.2 mM CaCl.2H2O (0.530 g)100 mM NaHepes (13.02 g)pH 7.4 w. HClTetracyclin Stock: Wash buffer (μl) Sucrose buffer (μl) 4x buffer 80000 35000 NaCl (1M) 34080 14910 H2O 199520 18970 Probenecid 6400 2800 Sucrose (1M) 0 68320 Total 320000 140000The total probenecid required to prepare the wash buffer and sucrose buffer is 6400+2800=9200 μl. An additional 500 μl of probenecid (5 plates at 100 μl each) is also required. Therefore, the total probenecid required is 9200 μl+500 μl=9700 μl. Sufficient probenecid is prepared using:690 mg probenecid;4850 μl NaOH 1M;1213 μl 4� buffer; and3638 μl H2O.Assay Experimental Protocol:1) Two days prior to commencement of the assay, seed 10,000 cells/well of 96 well black clear bottom plate (Greiner Poly-lysin plate). A 1:1 mix of Dulbecco's Modified Eagle's Medium: Nutrient Mixture F-12 (DMEM: F12) was obtained from Gibco. Tetracycline stock of 5 mg/ml in 96% ethanol is used. Medium: DMEM/F12/10% Donor Bovine Serum, Human AQP9 cell line+1:270,000 tetracyclin, mouse AQP9 cell line+1:2,700,000 tetracycline.2) Day of assay: Flick/slam off the medium and add 50 μl/well of loading solution: 5 ml DMEM/F12/10% Donor Bovine Serum, 25 μl Calcein AM from freshly dissolved aliquot in 50 μl DMSO (VWR #734-1434), and 100 μl Probenecid.3) Incubate the well for 90 minutes at 37� C.4) Perform one wash with 75 μl wash buffer.5) Add 75 μl of an example compound prepared in wash buffer per well.Example compounds are prepared in 500 μl U bottom PP plates (NUNC). 2.7 μl Substance in DMSO are added to row A; 180 μl of wash buffer+1% DMSO are added to rows B H. 90 μl from row A are transferred and mixed with all other wells (up to row G) to make a 3-fold dilution series.6) Assay in FLUOstar Optima at 25� C. Settings buffer addition at 135 μl/seconds, add 75 μl/well, record time course for 30 seconds, add sucrose buffer 3.6 seconds into recording.7) Normalization to initial in Excel.8) Fit to exponential decay function in GraphPad Prism 5.0, then arrange half live shrinking values according to wells and fit dose-response curves.
- Competition Binding This membrane based assay measures the ability of compounds to competitively bind GPR139 in stably transfected CHO-TRex membranes. CHO-TRex (Life Technologies) cells were stably expressed with human GPR139 receptor, whose expression is controlled by a tetracycline inducible element. The cells were cultured in medium containing F12K, 10% Tetracycline free FBS, 1% Penn/Strep, 200 ug/mL Hygromycin. GPR139 receptor expression was induced for 18 hrs with 1 ug/mL doxycycline (Sigma D9891) in growth media. After addition of doxycycline, cells were harvested in PBS and pelleted by centrifugation for 5 minutes at 200xG. Liquid was aspirated off and cells were resuspended in ice cold Lysis buffer (20 mM HEPES/5 mM EDTA pH 7.4/1x Roche protease inhibitor). Samples were vortexed until homogenous and then placed on ice and homogenized using Dounce homogenizer on 50% power 3 separate times for 10 strokes each time. Lysate was centrifuged at 4° C. for 10 minutes in a tabletop Sorvall at 2000xG and supernatant was recovered and centrifuged in a Sorvall Ultracentrifuge at 35,000 rpm for 30 minutes at 4° C. The supernatant was discarded and the remaining pellet resuspended in Lysis buffer (20 mM HEPES/0.1 mM EGTA/Roche protease inhibitor). Membrane protein concentration was determined using ThermoFisher BCA quantification kit and aliquoted into microtubes. Tubes were snap frozen in LN2 and stored at -80° C.Membranes were removed from -80° C., thawed and diluted in cold radioligand assay buffer (20 mM HEPES pH 7.4/5 mM MgCl2/l mM CaCl2/Roche protease inhibitor). Compounds suspended in DMSO were diluted in 1 nM (S)-N-(1-(2-[3H]-4-methoxyphenyl)propan-2-yl)-2-(2,3-dimethyl-7-oxothieno[2,3-d]pyridazin-6(7H)-yl)acetamide, readily prepared from (S)-N-(1-(2-chloro-4-hydroxyphenyl)propan-2-yl)-2-(2,3-dimethyl-7-oxothieno[2,3-d]pyridazin-6(7H)-yl)acetamide (20 mM HEPES pH 7.4/5 mM MgCl2/l mM CaCl2/Roche protease inhibitor fresh/(S)-N-(1-(2-chloro-4-methoxyphenyl)propan-2-yl)-2-(2,3-dimethyl-7-oxothieno[2,3-d]pyridazin-6(7H)-yl)acetamide) in a 0.3 mL 96 well polypropylene assay plate (Fisher Scientific). Membranes (10 ug) were added to the assay plate, spun for 30 seconds at 300 rpm in a tabletop Eppendorf centrifuge, and then incubated at room temperature for 20 minutes. Filtermat A (Perkin Elmer No. 1450-421) is pre-soaked in 0.5% PEI (Sigma P3143) for 3 hours and dried at room temperature overnight. The contents of the assay plate were transferred to Filtermat A (Perkin Elmer No. 1450-421) using Tomtec harvester and washed 5 times with cold wash buffer (Tris-HCl pH 7.5). Filtermats were dried using a microwave oven and placed in sample bags (Perkin Elmer No. 1450-432) with scintillator sheets (Perkin Elmer No. 1450-411). Scintillator sheets were melted to filtermats using a heat block set to 65° C., placed in MicroBeta cartridges and read using the MicroBeta scintillation counter.
- High Throughput Screening Assay The commercially available HEK293/TREx line (Invitrogen) was stably transfected with a TRPC5 construct and screened by conventional calcium imaging to find clones with TRPC5 expression following stimulation with 1 μg/ml tetracycline. These cells were maintained in the growth medium recommended by the manufacturer supplemented with 100 μg/ml hygromycin to promote retention of the TRPC5 construct. After growing to near confluency, cells were plated at a density of 35,000 cells/well in 384 well CellBind plates (Corning) in the presence of 1 μg/ml tetracycline, and allowed to grow for 20-30 hrs. A nearly confluent monolayer resulted. Cells were then loaded with Ca2+ dye: Fura-2/AM or Fluo4/AM was added to the wells to a final concentration of 4 μM or 0.5 μM, respectively, and incubated for 80 min or 60 min, respectively, at room temperature. Supernatant was then removed from the cells by inverting plates with a sharp flick, and 25 μl Hank's Balanced Salt Solution (HBSS; 0.185 g/l D-glucose, 0.9767 g/l MgS04 (anhydrous), 0.4 g/l KCl, 0.06 g/l KH2PO4 (anhydrous), 0.35 g/l NaHCO3, 8.0 g/l NaCl, and 0.04788 g/l Na2HPO4 (anhydrous); pH 7.4) was then added to each well. Following 0.5 hour for recovery from loading, cells were assayed using the Hamamatsu FDSS 6000 system, which permitted illumination alternately at 340 nm and 380 nm for Fura-2 experiments, or at 485 nm for Fluo4 experiments. Frames were acquired at a rate of 0.2 Hz. During the assay, the plates were continuously vortexed, with pipette mixing of wells following addition of each reagent. For the screening assay, 26 μl of a diluted compound stock (at 50 μM) was added to each well for 2 minutes following the collection of a short (4 frame) baseline. 13 μl 62 mM high-Ca2+Ringer solution (4.17 ml of normal ringer (with 2 mM Ca2+) plus 5.83 ml of isotonic calcium ringer (105 mM Ca2+; in this ringer all sodium has been replaced with calcium)) was then added to each well, achieving a final concentration of 14 mM Ca2+ and 10 μM test compound. Data was collected for 3 minutes following addition of high Ca2+Ringer, where the fluorescent intensity (for Fluo4) and the F340/F380 ratio (for Fura-2) were proportional to the [Ca2+]i Negative controls consisted of HEK293/TREx TRPC5 cells exposed to high Ca2+ solution, but no compound. Positive control conditions consisted of addition of 2-APB, a promiscuous blocker of TRPC5 and other channels, to columns 23 and 24 of the plates, to a final concentration of 200 μM. The Fluo4 cell-based fluorescence assay was used to determine the intracellular Ca2+ concentration in the presence of varying drug concentration. Final concentrations of compounds tested were 20 μM, 6.667 μM, 2.222 μM, 0.741 μM, 0.247 μM, 0.082 μM, and 0.027 μM. Compounds were tested in triplicate at all concentrations.
- Inhibition of KCNT1 KCNT1-WT-Basal - Patch Clamp Assay Inhibition of KCNT1 (KNa1.1, Slack) was evaluated using a tetracycline inducible cell line (HEK-TREX). Currents were recorded using the SyncroPatch 384PE automated, patch clamp system. Pulse generation and data collection were performed with PatchController384 V1.3.0 and DataController384 V1.2.1 (Nanion Technologies). The access resistance and apparent membrane capacitance were estimated using built-in protocols. Current were recorded in perforated patch mode (10 �M escin) from a population of cells. The cells were lifted, triturated, and resuspended at 800,000 cells/ml. The cells were allowed to recover in the cell hotel prior to experimentation. Currents were recorded at room temperature. The external solution contained the following (in mM): NaCl 105, NMDG 40, KC1 4, MgC12 1, CaC12 5 and HEPES 10 (pH = 7.4, Osmolarity ~300 mOsm). The extracellular solution was used as the wash, reference and compound delivery solution. The internal solution contained the following (in mM): NaCl 70, KF 70, KC1 10, EGTA 5, HEPES 5 and Escin 0.01 (pH = 7.2, Osmolarity ~295 mOsm). Escin is made at a 5 mM stock in water, aliquoted, and stored at -20� C. The compound plate was created at 2x concentrated in the extracellular solution. The compound was diluted to 1:2 when added to the recording well. The amount of DMSO in the extracellular solution was held constant at the level used for the highest tested concentration. A holding potential of -80 mV with a 100 ms step to 0 mV was used. Mean current was measured during the step to 0 mV. 100 �M Bepridil was used to completely inhibit KCNT1 current to allow for offline subtraction of non-KCNT1 current.
- Inhibition of cAMP Activity of GPR6 In Vitro Assay This cell based assay measures the ability of compounds to inhibit the constitutive cAMP activity of GPR6 receptor expressed in CHO-K1 cells. CHO cells were stably expressed with GPR6 receptor, whose expression is controlled by a tetracycline inducable element. The cells were cultured in medium containing F12K, 10% FBS, 1% Penn/Strep, 200 ug/mL Hygromycin. GPR6 receptor expression was induced for 20 hrs with 2 □g/ml doxycycline (sigma D9891) in growth media. After addition of doxycycline cells were plated at a density of 450-750 cells per well in 96-well half-volume black tissue culture plates (Costar) and placed in an incubator (37�, 5% CO2) for 20 hours prior to cAMP assays.Culture media was removed from cells and they were washed with 50 □L/well of Ringer's Buffer (MgCl2 0.047 mg/mL, NaH2PO4 0.18 mg/mL, Na2HPO4 0.1 mg/mL, KCl 0.34 mg/mL, NaHCO3 1.26 mg/mL, D-glucose 1.8 mg/mL, NaCl 7 mg/mL; pH=7.4). Compounds suspended in DMSO were diluted in Ringer's Buffer containing 0.5% fatty acid free BSA plus 300 μM IBMX and incubated on cells for 45 min at 37� and 5% CO2. After incubation cells were incubated for 10 min at room temp with Eu-cAMP tracer solution from a Perkin Elmer Lance HTRF Ultra cAMP assay kit (TRF0263). Then ULight -anti-cAMP solution from the Lance HTRF kit was added and incubated on a shaker at room temp for 1 hour prior to HTRF detection in a Perkin Elmer Envision plate reader.
- Assay Measuring Activity of Test Compounds on Viral Production from HepAD38 Cells HepAD38 cells grown in a T-150 flask (Corning, cat #: 430825) with Growth Medium (DMEM/F12 (1:1) (Hyclone, cat #: SH30023.02), 1� Pen/Strep (Invitrogen, cat #: 15140-122), 10% FBS (Tissue Culture Biologics, cat #: 101), 250 μg/mL G418 (Alfa Aesar, cat #: J62671), 1 μg/mL Tetracycline (Teknova, cat #: T3320)) were detached with 0.25% trypsin-EDTA to (Invitrogen, cat #: 25200-056). Tetracycline-free treatment medium (15 mL DMEM/F12 (1:1) 1� Pen/step, with 2% FBS, Tet-system approved (Clontech, cat #: 631106) were then added to mix, transferred into a 50 ml conical tube (Falcon, cat #: 21008-918,) and spun at 1300 rpm for 5 min. Pelleted cells were then re-suspended/washed with 50 mL of 1�DPBS (Invitrogen, cat #: 14190-136) 2 times and 50 mL treatment medium twice. HepAD38 cells were then re-suspended with 10 mL of treatment medium, syringed and counted. Wells of 96-well clear bottom TC plate (Corning, cat #: 3904,) were seeded at 50,000 cells/well in 180 μL of treatment medium, and 20 μL of either 10% DMSO (Sigma, cat #: D4540) as controls or a 10� solution of test compounds in 10% DMSO in treatment media was added for a final compound concentration starting at 10 μM, and plates were incubated in 5% CO2 incubator at 37� C. for 5 days.Subsequently viral load production was assayed by quantitative PCR (qPCR) of the HBV core sequence. PCR reaction mixture containing forward primers HBV-f 5′-CTGTGCCTTGGGTGGCTTT-3′ (IDT DNA), Reverse primers HBV-r 5′-AAGGAAAGAAGTCAGAAGGCAAAA-3′ (IDT DNA), Fluorescent TaqMan Probes HBV-probe 5′-FAM/AGCTCCAAA/ZEN/TTCTTTATAAGGGTCGATGTC/3IABkFQ-3′ (IDT DNA), 10 μL/well of PerfeCTa qPCR ToughMix (Quanta Biosciences, Cat #: 95114-05K), and 6 μL/well of DEPC water (Alfa Aesar, cat #: J62087) was prepared. Four 4 of supernatant was added to 16 μL of the reaction mixture in a qPCR plate (Applied Biosytems, Cat #: 4309849), sealed with a film (Applied Biosystems, Cat #: 4311971), centrifuged for a few seconds, and subsequently run on an Applied Biosystems VIIA7. The PCR mixture was incubated at 45� C. for 5 min, then 95� C. for 10 min, followed by 40 cycles of 10 seconds at 95� C. and 20 seconds at 60� C. Viral load was quantified against known HBV DNA standards by using ViiA 7 Software. Viral load in the supernatant from wells with treated cells were compared against viral load in supernatant from DMSO control wells (>3 per plate). Cell viability assay was performed with CellTiter-Glo Luminescent Cell Viability Assay (Promega, cat #: G7573) with modification. Mixed appropriate amount of CellTiter-Glo (CTG) 1�DPBS in a 1:1 ratio, added 100 uL of the mixture to each well followed completely removal of all supernatant in each well without touching cell surface. Incubated the plate at room temperature for 10 min on an orbital shaker, and then read the plate with a plate reader (TECAN M1000 or Envision).
- Biological Assays For measuring Npt2a activity in a cell based assay, a stable CHO cell line with inducible Npt2a expression was generated. Therefore, CHO T-Rex cells (life technologies cat. R718-07) were stably transfected with doxycycline-inducible human NPT2a (pcDNA5TO-hNpt2a). The obtained CHO T-REx hNpt2a cells were routinely cultured in Dulbecco's MEM/F12 (4.5 g/l Glucose, Gibco cat. 21331-020; 500 mL) supplemented with 10 ml Glutamax 100�, Sodium pyruvate (7 mL of 100 mM solution), HEPES (10 mL of 1 M solution), Sodium bicarbonate (10 mL of 7.5% solution), 10% Fetal Bovine Serum Tetracycline free (Clontech cat. 631106, 500 ml), Penicillin-Streptomycin (5 mL of 100� Solution), Blasticidin 10 μg/mL and 400 μg/mL Hygromycin.Activity of Npt2a was detected by following depolarization of cellular membrane potential by influx of sodium phosphate using fluorescent membrane potential dye kit BLUE (Molecular devices cat. R8034). For Npt2a activity measurements, CHO T-Rex hNpt2a cells were seeded into 1536 well microtiter plates (GREINER Bio-One cat. 782092) with 750 cells/well in 7 μL/w of complete medium (2% Tetracycline-free FBS, 2% Poly-D-Lysine) without selective agents+Doxycycline 0.5 μg/mL to induce Npt2a gene expression, and grown for 24 h at 37� C., 5% carbon dioxide.On the day of experiment a 1�MPdye Loading Solution was freshly prepared by re-suspending 15 mg of Blue MPdye powder in 10 mL of NHE buffer sodium-free (140 mM N-Methyl-D-glucamine, 5.4 mM KCl, 1 mM CaCl2, 11 mM D(�)-Glucose water free, 1.2 mM MgCl2, 10 mM HEPES; pH 7.4 (adjusted with hydrochloric acid); sterile filtered). 5 μl medium was removed from plates by robotic manipulation, then 5 μL/well of sodium-free NHE buffer was added. After incubation for 2 min, this washing step was repeated once. Then, 5 μL/w of buffer was removed from plates and cells were incubated for 5 min at room temperature with 5 μL/w of MPdye Loading Solution (1� in Sodium-free NHE Buffer). Test compounds were added to the cells at final test concentrations between 50 μM and 1 nM (0.6 μL/well, final DMSO 0.6%, prepared in MPDye Loading Solution) and incubated for 5 min at room temperature.Plates were analyzed with an in house CCD camera device using a λexc 510-545 nm/λem 565-625 nm filter. Fluorescence was detected for 15 sec (background measurement M1). Activity of Npt2a was triggered by addition of 2 μL/well of 30 mM Na+ and 1 mM phosphate (prepared in a mixture of NHE Buffer Na+ free and NHE Buffer 140 mM Na+). Fluorescence was followed for 2-3 min (depolarization measurement M2). Data was normalized to cell number and dye loading efficiency by calculating M2/M1. This quotient was plotted against test compound concentration. Graph Pad Prism or equivalent in house software was used to create sigmoidal dose-response curves (variable slope) and determine IC50 values.
- A.1 Inhibition of cAMP Activity of GPR6 In Vitro Assay This cell based assay measures the ability of compounds to inhibit the constitutive cAMP activity of GPR6 receptor expressed in CHO-K1 cells. CHO cells were stably expressed with GPR6 receptor, whose expression is controlled by a tetracycline inducible element. The cells were cultured in medium containing F12K, 10% FBS, 1% Penn/Strep, 200 ug/mL Hygromycin. GPR6 receptor expression was induced for 20 hrs with 10 g/ml doxycycline (sigma D9891) in growth media. After addition of doxycycline cells were plated at a density of 250-500 cells per well in half-volume black clear bottom plates (Costar) and place in an incubator (37�, 5% C(O)2) for 20 hours prior to cAMP assays.Culture media was removed from cells and they were washed with 50 L of Ringer's Buffer (MgCl2 0.047 mg/mL, NaH2PO4 0.18 mg/mL, Na2HPO4 0.1 mg/mL, KCl 0.34 mg/mL, NaHC(O)3 1.26 mg/mL, D-glucose 1.8 mg/mL, NaCl 7 mg/mL; pH=7.4). Compounds suspended in DMSO were diluted in Ringer's Buffer containing 0.5% fatty acid free BSA and incubated on cells for 45 min at 37� and 5% C(O)2. After incubation cells were incubated for 10 min at room temp with Eu-cAMP tracer solution from a Perkin Elmer Lance HTRF UltracAMP assay kit (TRF0264). Then ULight -anti-cAMP solution from the Lance HTRF kit was added and incubated on a shaker at room temp for 1 hour prior to HTRF detection in a BMG PolarStar Omega.IC50 curves were generated with a four-parameter logistic equation using GraphPad Prism 5.03.
- A.2 Inhibition of cAMP Activity of GPR6 In Vitro Assay This cell based assay measures the ability of compounds to inhibit the constitutive cAMP activity of GPR6 receptor expressed in CHO-K1 cells. CHO cells were stably expressed with GPR6 receptor, whose expression is controlled by a tetracycline inducible element. The cells were cultured in medium containing F12K, 10% FBS, 1% Penn/Strep, 200 ug/mL Hygromycin. GPR6 receptor expression was induced for 20 hrs with 2 □g/ml doxycycline (sigma D9891) in growth media. After addition of doxycycline cells were plated at a density of 450-750 cells per well in 96-well half-volume black tissue culture plates (Costar) and placed in an incubator (37�, 5% CO2) for 20 hours prior to cAMP assays.Culture media was removed from cells and they were washed with 50 L/well of Ringer's Buffer (MgCl2 0.047 mg/mL, NaH2PO4 0.18 mg/mL, Na2HPO4 0.1 mg/mL, KCl 0.34 mg/mL, NaHCO3 1.26 mg/mL, D-glucose 1.8 mg/mL, NaCl 7 mg/mL; pH=7.4). Compounds suspended in DMSO were diluted in Ringer's Buffer containing 0.5% fatty acid free BSA plus 300 μM IBMX and incubated on cells for 45 min at 37� and 5% CO2. After incubation cells were incubated for 10 min at room temp with Eu-cAMP tracer solution from a Perkin Elmer Lance HTRF Ultra cAMP assay kit (TRF0263). Then ULight -anti-cAMP solution from the Lance HTRF kit was added and incubated on a shaker at room temp for 1 hour prior to HTRF detection in a Perkin Elmer Envision plate reader.EC50 curves were generated with a four-parameter logistic equation using GraphPad Prism 5.03.
- Inhibition of cAMP Activity of GPR6 In Vitro A.1 Assay This cell based assay measures the ability of compounds to inhibit the constitutive cAMP activity of GPR6 receptor expressed in CHO-K1 cells. CHO cells were stably expressed with GPR6 receptor, whose expression is controlled by a tetracycline inducable element. The cells were cultured in medium containing F12K, 10% FBS, 1% Penn/Strep, 200 ug/mL Hygromycin. GPR6 receptor expression was induced for 20 hrs with 1 μg/ml doxycycline (sigma D9891) in growth media. After addition of doxycycline cells were plated at a density of 250-500 cells per well in half-volume black clear bottom plates (Costar) and place in an incubator (37�, 5% C(O)2) for 20 hours prior to cAMP assays. Culture media was removed from cells and they were washed with 50 μL of Ringer's Buffer (MgCl2 0.047 mg/mL, NaH2PO4 0.18 mg/mL, Na2HPO4 0.1 mg/mL, KCl 0.34 mg/mL, NaHC(O)3 1.26 mg/mL, D-glucose 1.8 mg/mL, NaCl 7 mg/mL; pH=7.4). Compounds suspended in DMSO were diluted in Ringer's Buffer containing 0.5% fatty acid free BSA and incubated on cells for 45 min at 37� and 5% C(O)2. After incubation cells were incubated for 10 min at room temp with Eu-cAMP tracer solution from a Perkin Elmer Lance HTRF UltracAMP assay kit (TRF0264). Then ULight-anti-cAMP solution from the Lance HTRF kit was added and incubated on a shaker at room temp for 1 hour prior to HTRF detection in a BMG PolarStar Omega. IC50 curves were generated with a four-parameter logistic equation using GraphPad Prism 5.03.
- Inhibition of cAMP Activity of GPR6 In Vitro A.2 Assay This cell based assay measures the ability of compounds to inhibit the constitutive cAMP activity of GPR6 receptor expressed in CHO-K1 cells. CHO cells were stably expressed with GPR6 receptor, whose expression is controlled by a tetracycline inducable element. The cells were cultured in medium containing F12K, 10% FBS, 1% Penn/Strep, 200 ug/mL Hygromycin. GPR6 receptor expression was induced for 20 hrs with 2 μg/ml doxycycline (sigma D9891) in growth media. After addition of doxycycline cells were plated at a density of 450-750 cells per well in 96-well half-volume black tissue culture plates (Costar) and placed in an incubator (37�, 5% CO2) for 20 hours prior to cAMP assays. Culture media was removed from cells and they were washed with 50 μL/well of Ringer's Buffer (MgCl2 0.047 mg/mL, NaH2PO4 0.18 mg/mL, Na2HPO4 0.1 mg/mL, KCl 0.34 mg/mL, NaHCO3 1.26 mg/mL, D-glucose 1.8 mg/mL, NaCl 7 mg/mL; pH=7.4). Compounds suspended in DMSO were diluted in Ringer's Buffer containing 0.5% fatty acid free BSA plus 300 μM IBMX and incubated on cells for 45 min at 37� and 5% CO2. After incubation cells were incubated for 10 min at room temp with Eu-cAMP tracer solution from a Perkin Elmer Lance HTRF Ultra cAMP assay kit (TRF0263). Then ULight-anti-cAMP solution from the Lance HTRF kit was added and incubated on a shaker at room temp for 1 hour prior to HTRF detection in a Perkin Elmer Envision plate reader. IC50 curves were generated with a four-parameter logistic equation using GraphPad Prism 5.03.
- Sodium Influx Assay (In Vitro Assay) This sodium influx assay employs the use of the cell permeable, sodium sensitive dye ANG2 to quantify sodium ion influx through sodium channels which are maintained in an open state by use of sodium channel modulators. This high throughput sodium influx assay allows for rapid profiling and characterization of sodium channel blockers.In general, Trex HEK293 cells were stably transfected with an inducible expression vector containing the full-length cDNA coding for the desired human sodium channel α-subunit and with an expression vector containing full length cDNA coding for the β1-subunit. Sodium channel expressing cell lines were induced with tetracycline (1 μg/mL) and plated on 384-well PDL-coated plates at a density of 25K-30K cells/well in culture media (DMEM, containing 10% FBS and 1% L-glutamine). After overnight incubation (37� C., 5% CO2), culture media was removed and cells were loaded with 5 uM ANG2 dye for 1-1.5 h in Buffer 1 (155 mM NMDG, 5 mM KCl, 2 mM CaCl2, 1 mM MgCl2, 10 mM HEPES, 10 mM glucose, adjusted with Tris to pH 7.4). Access dye was removed and cells were incubated with test compounds for 1 hr in buffer 1 containing sodium channel modulator(s) at room temperature. Hamamatsu FDSS μCell was used to perform a 1:1 addition of Na/K challenge buffer (140 mM NaCl, 20 mM HEPES, 1 mM CaCl2, 15 mM KCl, 1 mM MgCl2, 10 mM glucose, adjusted with Tris to pH 7.4) and simultaneously read plates at excitation wavelength of 530 nm and emission wavelength set at 558 nm. Percent inhibition of sodium ion influx was calculated for each test compound at each test concentration to determine the IC50 values.
- Sodium Influx Assay (In Vitro Assay) This sodium influx assay employs the use of the cell permeable, sodium sensitive dye ANG2 to quantify sodium ion influx through sodium channels which are maintained in an open state by use of sodium channel modulators. This high throughput sodium influx assay allows for rapid profiling and characterization of sodium channel blockers.In general, Trex HEK293 cells were stably transfected with an inducible expression vector containing the full-length cDNA coding for the desired human sodium channel α-subunit and with an expression vector containing full length cDNA coding for the β1-subunit. Sodium channel expressing cell lines were induced with tetracycline (1 μg/mL) and plated on 384-well PDL-coated plates at a density of 25K-30K cells/well in culture media (DMEM, containing 10% FBS and 1% L-glutamine). After overnight incubation (37� C., 5% CO2), culture media was removed and cells were loaded with 5 uM ANG2 dye for 1-1.5 h in Buffer 1 (155 mM NMDG, 5 mM KCl, 2 mM CaCl2, 1 mM MgCl2, 10 mM HEPES, 10 mM glucose, adjusted with Tris to pH 7.4). Access dye was removed and cells were incubated with test compounds for 1 hr in buffer 1 containing sodium channel modulator(s) at room temperature. Hamamatsu FDSS ρCell was used to perform a 1:1 addition of Na/K challenge buffer (140 mM NaCl, 20 mM HEPES, 1 mM CaCl2, 15 mM KCl, 1 mM MgCl2, 10 mM glucose, adjusted with Tris to pH 7.4) and simultaneously read plates at excitation wavelength of 530 nm and emission wavelength set at 558 nm. Percent inhibition of sodium ion influx was calculated for each test compound at each test concentration to determine the IC50 values.
- Sodium Influx Assay (In Vitro Assay) This sodium influx assay employs the use of the cell permeable, sodium sensitive dye ANG2 to quantify sodium ion influx through sodium channels which are maintained in an open state by use of sodium channel modulators. This high throughput sodium influx assay allows for rapid profiling and characterization of sodium channel blockers.In general, Trex HEK293 cells were stably transfected with an inducible expression vector containing the full-length cDNA coding for the desired human sodium channel α-subunit and with an expression vector containing full length cDNA coding for the β1-subunit. Sodium channel expressing cell lines were induced with tetracycline (1 μg/mL) and plated on 384-well PDL-coated plates at a density of 25K-30K cells/well in culture media (DMEM, containing 10% FBS and 1% L-glutamine). After overnight incubation (37� C., 5% CO2), culture media was removed and cells were loaded with 5 uM ANG2 dye for 1-1.5h in Buffer 1 (155 mM NMDG, 5 mM KCl, 2 mM CaCl2, 1 mM MgCl2, 10 mM HEPES, 10 mM glucose, adjusted with Tris to pH 7.4). Access dye was removed and cells were incubated with test compounds for 1 hr in buffer 1 containing sodium channel modulator(s) at room temperature. Hamamatsu FDSS μCell was used to perform a 1:1 addition of Na/K challenge buffer (140 mM NaCl, 20 mM HEPES, 1 mM CaC2, 15 mM KCl, 1 mM MgCl2, 10 mM glucose, adjusted with Tris to pH 7.4) and simultaneously read plates at excitation wavelength of 530 nm and emission wavelength set at 558 nm. Percent inhibition of sodium ion influx was calculated for each test compound at each test concentration to determine the IC50 values.
- cAMP assay A.1 This cell based assay measures the ability of compounds to inhibit the constitutive cAMP activity of GPR6 receptor expressed in CHO-K1 cells. CHO cells were stably expressed with GPR6 receptor, whose expression is controlled by a tetracycline inducable element. The cells were cultured in medium containing F12K, 10% FBS, 1% Penn/Strep, 200 ug/mL Hygromycin. GPR6 receptor expression was induced for 20 hrs with 1 μg/ml doxycycline (sigma D9891) in growth media. After addition of doxycycline cells were plated at a density of 250-500 cells per well in half-volume black clear bottom plates (Costar) and place in an incubator (37�, 5% C(O)2) for 20 hours prior to cAMP assays. Culture media was removed from cells and they were washed with 50 μL of Ringer's Buffer (MgCl2 0.047 mg/mL, NaH2PO4 0.18 mg/mL, Na2HPO4 0.1 mg/mL, KCl 0.34 mg/mL, NaHC(O)3 1.26 mg/mL, D-glucose 1.8 mg/mL, NaCl 7 mg/mL; pH=7.4). Compounds suspended in DMSO were diluted in Ringer's Buffer containing 0.5% fatty acid free BSA and incubated on cells for 45 min at 37� and 5% C(O)2. After incubation cells were incubated for 10 min at room temp with Eu-cAMP tracer solution from a Perkin Elmer Lance HTRF UltracAMP assay kit (TRF0264). Then ULight-anti-cAMP solution from the Lance HTRF kit was added and incubated on a shaker at room temp for 1 hour prior to HTRF detection in a BMG PolarStar Omega. IC50 curves were generated with a four-parameter logistic equation using GraphPad Prism 5.03.
- cAMP assay A.2 Inhibition of cAMP Activity of GPR6 In Vitro AssayThis cell based assay measures the ability of compounds to inhibit the constitutive cAMP activity of GPR6 receptor expressed in CHO-K1 cells. CHO cells were stably expressed with GPR6 receptor, whose expression is controlled by a tetracycline inducable element. The cells were cultured in medium containing F12K, 10% FBS, 1% Penn/Strep, 200 ug/mL Hygromycin. GPR6 receptor expression was induced for 20 hrs with 2 μg/ml doxycycline (sigma D9891) in growth media. After addition of doxycycline cells were plated at a density of 450-750 cells per well in 96-well half-volume black tissue culture plates (Costar) and placed in an incubator (37�, 5% CO2) for 20 hours prior to cAMP assays. Culture media was removed from cells and they were washed with 50 μL/well of Ringer's Buffer (MgCl2 0.047 mg/mL, NaH2PO4 0.18 mg/mL, Na2HPO4 0.1 mg/mL, KCl 0.34 mg/mL, NaHCO3 1.26 mg/mL, D-glucose 1.8 mg/mL, NaCl 7 mg/mL; pH=7.4). Compounds suspended in DMSO were diluted in Ringer's Buffer containing 0.5% fatty acid free BSA plus 300 μM IBMX and incubated on cells for 45 min at 37� and 5% CO2. After incubation cells were incubated for 10 min at room temp with Eu-cAMP tracer solution from a Perkin Elmer Lance HTRF Ultra cAMP assay kit (TRF0263). Then ULight -anti-cAMP solution from the Lance HTRF kit was added and incubated on a shaker at room temp for 1 hour prior to HTRF detection in a Perkin Elmer Envision plate reader. IC50 curves were generated with a four-parameter logistic equation using GraphPad Prism 5.03.
- High Throughput Screening Assay This screening assay measures TRPC6 (transient receptor potential cation channel, subfamily C, member 6) ion channel activation via addition either of the commercially available DAG ligand analogue OAG (1-oleoyl-2-acetyl-sn-glycerol) or of the TRPC6 agonist 1-[1-(4,5,6,7,8-pentahydrocyclohepta[2,1-d]thiophen-2-ylcarbonyl)-4-piperidyl]-3-hydrobenzimidazol-2-one (GSK1702934A). The assay utilizes a FLIPR fluorescent calcium sensor 4-(6-Acetoxymethoxy-2,7-difluoro-3-oxo-9-xanthenyl)-4′-methyl-2,2′-(ethylenedioxy)dianiline-N,N,N′,N′-tetraacetic acid tetrakis(acetoxymethyl) ester (Fluo4/AM) membrane potential (FMP) dye from Molecular Devices, which is a voltage sensitive indicator with a fluorescent quencher. Changes (increases) in intracellular membrane calcium concentration potential as measured by the fluorescent signal increase during membrane depolarization provide a measurement of channel activity.The commercially available HEK293/TREx line (Invitrogen) was stably transfected with a TRPC6 construct and screened by conventional calcium imaging to find clones with TRPC6 expression following stimulation with 1 μg/ml tetracycline. These cells were maintained in the growth medium recommended by the manufacturer supplemented with 100 μg/ml hygromycin to promote retention of the TRPC6 construct. After growing to near confluency, cells were plated at a density of 35,000 cells/well in 384 well CellBind plates (Corning) in the presence of 1 μg/ml tetracycline, and allowed to grow for 20-30 hrs. A nearly confluent monolayer resulted. Growth media was removed from the wells and cells were then loaded with 25 mL Fluo4/AM diluted in Ringer's Solution (6.5 g NaCl, 0.42 g KCl, 0.25 g CaCl2) and 0.2 g of sodium bicarbonate; pH 7.4) supplemented with 1% Pluronic F-127 to a final concentration of 0.5 μM and incubated for 60 min, at room temperature. Dye solution was then removed from the cells by inverting plates with a sharp flick, and replaced with 25 μl Ringer's. Following 0.5 hour for recovery from loading, cells were assayed using the Hamamatsu FDSS 6000 system, which permitted illumination at 485 nm. Frames were acquired at a rate of 0.2 Hz. During the assay, the plates were continuously vortexed, with pipette mixing of wells following addition of each reagent. For the screening assay, 26 μl of a diluted compound stock (at 50 μM) was added to each well for 2 minutes following the collection of a short (4 frame) baseline. 13 μl of agonist solution consisting of 125 nM GSK1702934A diluted in high-Ca2+Ringer solution (containing 90 mm Ca2+) was then added to each well, achieving a final concentration of 20 mm Ca2+ and 10 μM test compound. Data was collected for 3 minutes following addition of high Ca2+Ringer. The fluorescent ratio for each well was divided by the initial fluorescent intensity for that well and the overall response was determined by averaging the fluorescent ratio of the last 4 frames acquired during the experiment excepting the final frame. Negative and Positive controls were included on each plate. Negative controls wells consisted of HEK293/TREx TRPC6 cells exposed to assay buffer and agonist solution, but no test compound. Positive control consisted of wells consisted of HEK293/TREx TRPC6 cells exposed to 25 μM 3-[(2-chlorophenoxy)methyl]phenyl piperidyl ketone (Chembridge) diluted in Ringer's solution and agonist solution. These controls defined zero percent and 100 percent block respectively, and intensity of each well was normalized to these values.IC50s were determined using the above fluorescence method with the exception that instead of testing the compounds at 10 μM, compounds were tested at final concentrations of 20 μM, 6.667 μM, 2.222 μM, 0.741 μM, 0.247 μM, 0.082 μM, and 0.027 μM. Compounds were tested in triplicate at all concentrations. Standard software was used to fit IC50 curves.
- mGlu3 Ca2+ Flux Assay Gα15/TREx cells stably expressing rat mGlu3 were plated in black-walled, clear-bottomed, poly-D-lysine coated 384-well plates in 20 μL of assay medium (DMEM containing 10% dialyzed FBS, 20 mM HEPES, 25 ng/mL tetracycline, 100 units/mL penicillin/streptomycin plus 250 ng/mL Fungizone, and 1 mM sodium pyruvate) at a density of 15K cells/well. The cells were grown overnight at 37� C. in the presence of 5% CO2. The next day, medium was removed and the cells incubated with 20 μL of 2.3 LM Fluo-4, AM prepared as a 2.3 mM stock in DMSO and mixed in a 1:1 ratio with 10% (w/v) pluronic acid F-127 and diluted in assay buffer (Hank's balanced salt solution, 20 mM HEPES, and 2.5 mM probenecid) for 60 minutes at room temperature. Dye was removed, 20 μL of assay buffer was added, and the plate was incubated for 10 minutes at room temperature.Ca2+ flux was measured using the Functional Drug Screening System (FDSS7000, Hamamatsu, Japan). After establishment of a fluorescence baseline for about 3 seconds, the compounds of the present invention were added to the cells, and the response in cells was measured. 2.3 minutes later an EC20 concentration of the mGlu3 receptor agonist glutamate was added to the cells, and the response of the cells was measured for 1.9 minutes; an EC80 concentration of agonist was added and readings taken for an additional 1.7 minutes. All test compounds were dissolved and diluted to a concentration of 10 mM in 100% DMSO. Compounds were then serially diluted 1:3 in DMSO into 10 point concentration response curves, transferred to daughter plates, and further diluted into assay buffer to a 2� stock. Calcium fluorescence measures were recorded as fold over basal fluorescence; raw data was then normalized to the maximal response to glutamate. Antagonism of the agonist response of the mGlu3 receptor in the present invention was observed as a decrease in response to nearly maximal concentrations of glutamate in the presence of compound compared to the response to glutamate in the absence of compound.The raw data file containing all time points was used as the data source in the analysis template. This was saved by the FDSS as a tab-delimited text file. Data were normalized using a static ratio function (F/F0) for each measurement of the total 360 values per well divided by each well's initial value. Data were then reduced to peak amplitudes (Max−Initial Min) using a time range that starts approximately 3 seconds prior to the glutamate EC80 addition and continues for approximately 90 seconds. This is sufficient time to capture the peak amplitude of the cellular calcium response. Individual amplitudes were expressed as % EMax by multiplying each amplitude by 100 and then dividing the product by the mean of the amplitudes derived from the glutamate ECMax-treated wells. EC50 values for test compounds were generated by fitting the normalized values versus the log of the test compound concentration (in mol/L) using a 4 parameter logistic equation where none of the parameters were fixed. Each of the three values collected at each concentration of test compound were weighted evenly.
- mGlu Receptor In Vitro Assays Human Embryonic Kidney (HEK-293) cell lines co-expressing rat mGlu receptors 2, 3, 4, 6, 7 or 8 and G protein-coupled inwardly-rectifying potassium (GIRK) channels were grown in Growth Media containing 45% DMEM, 45% F-12, 10% FBS, 20 mM HEPES, 2 mM L-glutamine, antibiotic/antimycotic, non-essential amino acids, 700 μg/ml G418, and 0.6 μg/ml puromycin at 37� C. in the presence of 5% CO2. Cells expressing rat mGlui and mGlu5 receptor were cultured as described in Hemstapat et al (Mol. Pharmacol. 2006, 70, 616-626). All cell culture reagents were purchased from Invitrogen Corp. (Carlsbad, Calif.) unless otherwise noted. Calcium assays were used to assess activity of compounds at mGlu1 and mGlu5, as previously described in Engers et al (J. Med. Chem. 2009, 52, 4115-4118). Calcium assays at mGlu3 were performed as described for mGlu5 with the exception that TREx293 mGlu3 Gα15 cells were treated with tetracycline at 20 ng/mL for 20 h prior to assay.Compound activity at the group II (mGlu2 and mGlu3) and group III (mGlu4, mGlu6, mGlu7, and mGlu8) was assessed using thallium flux through GIRK channels, a method that has been described in detail. Briefly, cells were plated into 384-well, black-walled, clear-bottomed poly-D-lysine-coated plates at a density of 15,000 cells/20 μL/well in DMEM containing 10% dialyzed FBS, 20 mM HEPES, and 100 units/mL penicillin/streptomycin (assay media). Plated cells were incubated overnight at 37� C. in the presence of 5% CO2. The following day, the medium was exchanged from the cells to assay buffer [Hanks' balanced salt solution (Invitrogen) containing 20 mM HEPES, pH 7.3] using an FLX405 microplate washer (BioTek), leaving 20 μL/well, followed by the addition of 20 μL/well FluoZin2-AM (330 nM final concentration) indicator dye (Invitrogen; prepared as a stock in DMSO and mixed in a 1:1 ratio with Pluronic acid F-127) in assay buffer. Cells were incubated for 1 h at room temperature, and the dye exchanged to assay buffer using an ELX405, leaving 20 μL/well. Test compounds were diluted to 2 times their final desired concentration in assay buffer (0.3% DMSO final concentration). Agonists were diluted in thallium buffer [125 mM sodium bicarbonate (added fresh the morning of the experiment), 1 mM magnesium sulfate, 1.8 mM calcium sulfate, 5 mM glucose, 12 mM thallium sulfate, and 10 mM HEPES, pH 7.3] at 5 times the final concentration to be assayed. Cell plates and compound plates were loaded onto a kinetic imaging plate reader (FDSS 6000 or 7000; Hamamatsu Corporation, Bridgewater, N.J.). Appropriate baseline readings were taken (10 images at 1 Hz; excitation, 470�20 nm; emission, 540�30 nm) and test compounds were added in a 20 μL volume and incubated for approximately 2.5 min before the addition of 10 μL of thallium buffer with or without agonist. After the addition of agonist, data were collected for approximately an additional 2.5 min. Data were analyzed using Excel (Microsoft Corp, Redmond, Wash.). The slope of the fluorescence increase beginning 5 s after thallium/agonist addition and ending 15 s after thallium/agonist addition was calculated, corrected to vehicle and maximal agonist control slope values, and plotted in using either XLfit (ID Business Solutions Ltd) or Prism software (GraphPad Software, San Diego, Calif.) to generate concentration-response curves. Potencies were calculated from fits using a four-point parameter logistic equation. For concentration-response curve experiments, compounds were serially diluted 1:3 into 10 point concentration response curves and were transferred to daughter plates using an Echo acoustic plate reformatter (Labcyte, Sunnyvale, Calif.).